Scientific Interpretation
Wage earners (status): There are distinctive regional disparities and clusters across Romania. The average rate of wage earners is 65.8%. One can find the highest rates in provinces with larger cities such as Bucharest (75.9 %) and its surrounding province Ilfov (57.2%) or Cluj (55.9%). There are also high rates near the western border (Arad, Bihor), which are attractive locations for foreign direct investments. The lowest rates of wage earners can be found in provinces that are still dominated by the agricultural sector or old industries from communist times such as Botoasani (20.9%) and Vaslui (18.1%).
Wage earners (development): Between 2015 and 2019 regional disparites in the ratio of wage earners has increased. While some dynamic and urbanized provinces such as Ilfov (+10.7 percentage points) and Cluj (+6.2 percentage points) registered significant increases, the rate of wage earners was decreasing in most Romanian provinces. Increasing rates could not only be found in urbanized regions, but also in some rather provinces with a strong industrial base (Dambovita, Arges). In addition, decreasing rates of wage earners were also registered in rather urbanized regions such as Iași and Sibiu. Hunedoara showed the strongest decrease (-7.9 percentage points)

Demographic dependency ratio (status): Spatial disparities in the demographic dependency ratio are not very significant and no clear spatial patterns are visible. The mean ratio is 46.6. Relatively low rates can be found in provinces with university cities like Timiș (43.5), or Iaşi (44.4), but the lowest rates are reported for rural counties such as Gorj (42.2) and Galati (42.4). High dependency ratios can be found especially in the south and south-east of Romania. Teleorman shows the highest rate (55.2).

Knowledge workers (status): There are significant spatial disparities and a strong clustering of the knowledge industry in the Bucharest region. The average share of highly qualified workers in Romania is 4%. The highest concentration can be found in Bucharest (12.7%). In general, one can say that there is a strong concentration of knowledge workers in provinces dominated by large cities or university cities (Timiș, Cluj, Iaşi). On the other side, there is a low share of knowledge workers in rural and old industrial regions. The lowest rate was registered in Bistrița-Năsăud (2.7%).
Knowledge workers (development): There are no clear spatial patterns regarding the development of the share of knowledge workers between 2015 and 2019. The average change rate across all provinces is +0.12 percentage points. The highest increase was registered in Harghita (+0.86 percentage points), the strongest decrease can be found in Dolj (-0.76 percentage points). Increasing shares were registered in urbanised provinces such as Timis and Ilvof but also in many rural provinces.

School dropout rate (status): There are no clear spatial patterns of disparities. The average school dropout rate is 2.8%. Sibiu shows the highest dropout rate (6.5%) but can be interpreted as an outlier. The second highest dropout rate can be found in Hunedoara (4.1%). Bihor shows the lowest proportion (1.5%). The school dropout rate might be biased due to unreported cases in rural areas, where in order to maintain public schools a minimum number of registered children is necessary.
School dropout rate (development): There are no clear spatial patterns in the development of the abandon rate in pre-university education. The strongest increase could be found in Hunedoara (+2 percentage points), the strongest decrease in Braila (-2.4 percentage points).
Income (status): The distribution of income shows strong spatial disparities. High incomes are concentrated in urbanised regions. In addition, one can find a spatial cluster of high income provinces in central Romania. The average income across all provinces is 3857 LEI. Income levels in Bucharest are by far the highest in the country (6057 LEI), while the lowest average income can be found in Bistrița-Năsăud (3365 LEI). Due to limited income opportunities most rural areas fall significantly behind the dynamic urban areas.
Income (development): The development (2014-2018) of income underlines the significant urban-rural disparities. Romania witnessed strong economic growth during the last few years, but at the same time an increase of spatial disparities. Rural and old industrial provinces such as Gorj show a rather low increase (+1400 LEI) whereas urban provinces such as Bucharest registered a strong increase (+2719 LEI). A pattern of strong income increase also appears in central Romania.

Life expectancy (status): There are significant disparities with spatial clustering of higher life expectancy in central Romania. In 2019 the average life expectancy in Romania amounted to 75.6 years with the highest expectancy in Valcea (80.8 years) and the lowest in Tulcea (73.7 years). Many regions in eastern and south-eastern Romania have a low life expectancy while a higher life expectancy can be found in urban regions, especially in central Romania.
Life expectancy (development): The development of life expectancy from 1990 to 2019 reveals strongly increasing disparities. On average the life expectancy increased by 6.2 years. The highest increase was registered in Valcea (+10.9 years), the lowest increase can be found in Tulcea (+4 years). Again there is a remarkable increase in urbanised regions such as Bucharest, Timiș or Cluj. A look at the map also exhibits significant disparities between western and eastern Romania. One exception is Constanţa, which showed the second highest increase (+8.6 years) since the end of the socialist era.

Family doctors (status): The distribution of doctors displays a strong disbalance between eastern and western Romania. The average number of family physicians per 100,000 inhabitants in Romania is 57.3. Bucharest leads the list of counties (99.2) while Ilfov (36.3) forms the bottom. Both can be interpreted as outliers because Ilfov is the surrounding region of Bucharest. The second places display the distribution more meaningful. The second highest number of family physicians can be found in Timis (84.7) which lies at the western border, and the second lowest share of family doctors was reported for Calarasi (39.9) in the east.

Tubercolosis cases (status):There are strong regional disparities. The highest numbers of tubercolosis cases per capita can be found in the southern and eastern border regions of Romania such as Teleorman (90.5) and Constanta (83.4). Low rates can be found in central Romania (Covasna, Bistrita-Nasaud, Sibiu) and particularly in Harghita (18.6).
Tubercolosis cases (development):While the number of tubercolosis cases per 100,000 inhabitants was declining all across the country, some provinces such as Timis (+10.3) and Vrancea (+10.1) registered significant increases. However, there are no clear spatial patterns.

Gender pay gap (status): Romania has one of the lowest gender pay gaps in the EU. On average, the income of women equals around 96.7% of men’s income. but there are significant regional disparities which are strongly related to the general economic development of a region. In less developed regions such as Vaslui (112%) or Botosani (111.6%) women usually earn higher incomes than men. In regions with a stronger degree of industrialization and/or urbanization, such as Ilfov (87.5%) and Prahova (92.2%), women have a lower income compared to men.
Water supply (status): There are strong disparities between relatively wealthy urbanised regions such as Bucharest, Timis or Cluj and rural/old industrial regions. A look at the map reveals that there is a spatial clustering of poor water supply in the southern border region and in the north-east. The share of population connected to the public water supply varies from 34.2% in Teleorman up to 98.5% in Brăila. On average 66.1% of the Romanians have access to public fresh water.

Fiscal balance (status): The fiscal balance shows strong disparities between the provinces but there are no distinguishable spatial patterns. High surpluses appear rather in rural provinces, especially in border regions (Satu Mare, Giurgiu, Tulcea). The highest surplus per inhabitant was reported for rural Mehedinti (175,262.5 LEI) whereas the capital Bucharest had the lowest surplus (45.8 LEI). In general, urbanised regions such as Timis or Constanta tend to show a lower surplus. The average surplus per inhabitant is 35,168.9 LEI.

Voter turnout (status): There are remarkable spatial clusters of high or low voter turnouts. A high voter turnout is typically associated with wealth and education. In Romania, this assumption does not seem to fit. For example, Bucharest as the wealthy capital shows the lowest average voter turnout (35.0%) in the whole country. In contrast to this stand the rural regions at the southern border which show a high voter turnout. The highest voter turnout can be found in Giurgiu (59.8%). A pattern of low voter turnouts appears in the eastern part of Romania.
Internal migration The internal migration balance reveals strong spatial disparities between urbanised and rural regions. Due to the lack of job opportunities and perspectives in rural and old industrial regions in the north-east and south, those regions registered massive migration losses from 2015 till 2019. Vaslui witnessed the highest migration loss with -44.8 emigrants per 1000 inhabitants. Meanwhile, the urbanised regions (Bucharest, Cluj, Timis) gained population due to internal migration. The highest net migration rate was recorded in Iaşi (+59.9).

External migration: Many Romanian provinces lost population due to external migration, but there are strong spatial disparities. The number of emigrants per 1,000 inhabitants is high in urbanized provinces with a highly educated workforce, such as Bucharest (9.96), Iaşi (9.37) and Timis (8.97). But also rather rural border regions such as Caras-Severin (9.74) and Galati (8.70) registered high numbers of emigrants. The lowest number of emigrants per 1,000 inhabitants was reported for Harghita (1.68).
Wissenschaftliche Interpretation
Cluster: Clusterlösung 1 Cluster: Clusterlösung 2 Economy, employment and labour market Educational opportunities Prosperity and health State action and participation Migration

User guide▼Please type the name of a municipality in the search option 🔍 of the map window and click on its area in the map to display the indicator values in the table below.

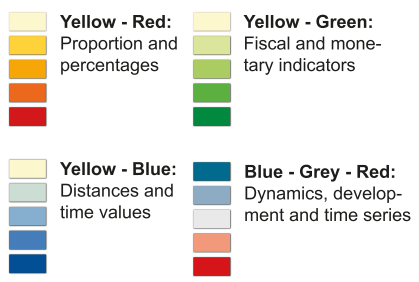
Colour scheme▼

Interpretations
  • Cluster types
  • Status
  • Development

Cluster

  • Romania
  • Bucharest
  • Dynamic urbanized regions
  • Romania's rural middle
  • Rural and old industrial regions with significant socio-economic challenges

Economy, employment and labour market

  • Wage earners
  • Demographic dependency ratio
  • Employment rate
  • Knowledge workers

Educational opportunities

  • School Dropout Rate

Prosperity and health

  • Live expectancy
  • Income
  • Family doctors
  • Tuberculosis cases
  • Gender pay gap

State action and participation

  • Water supply
  • Voter turnout
  • Fiscal balance

Migration

  • Internal migration
  • External migration

Economy, employment and labour market

  • Wage earners
  • Gross domestic product
  • Knowledge workers

Educational opportunities

  • School Dropout Rate

Prosperity and health

  • Life expectancy
  • Income
  • Tuberculosis cases